
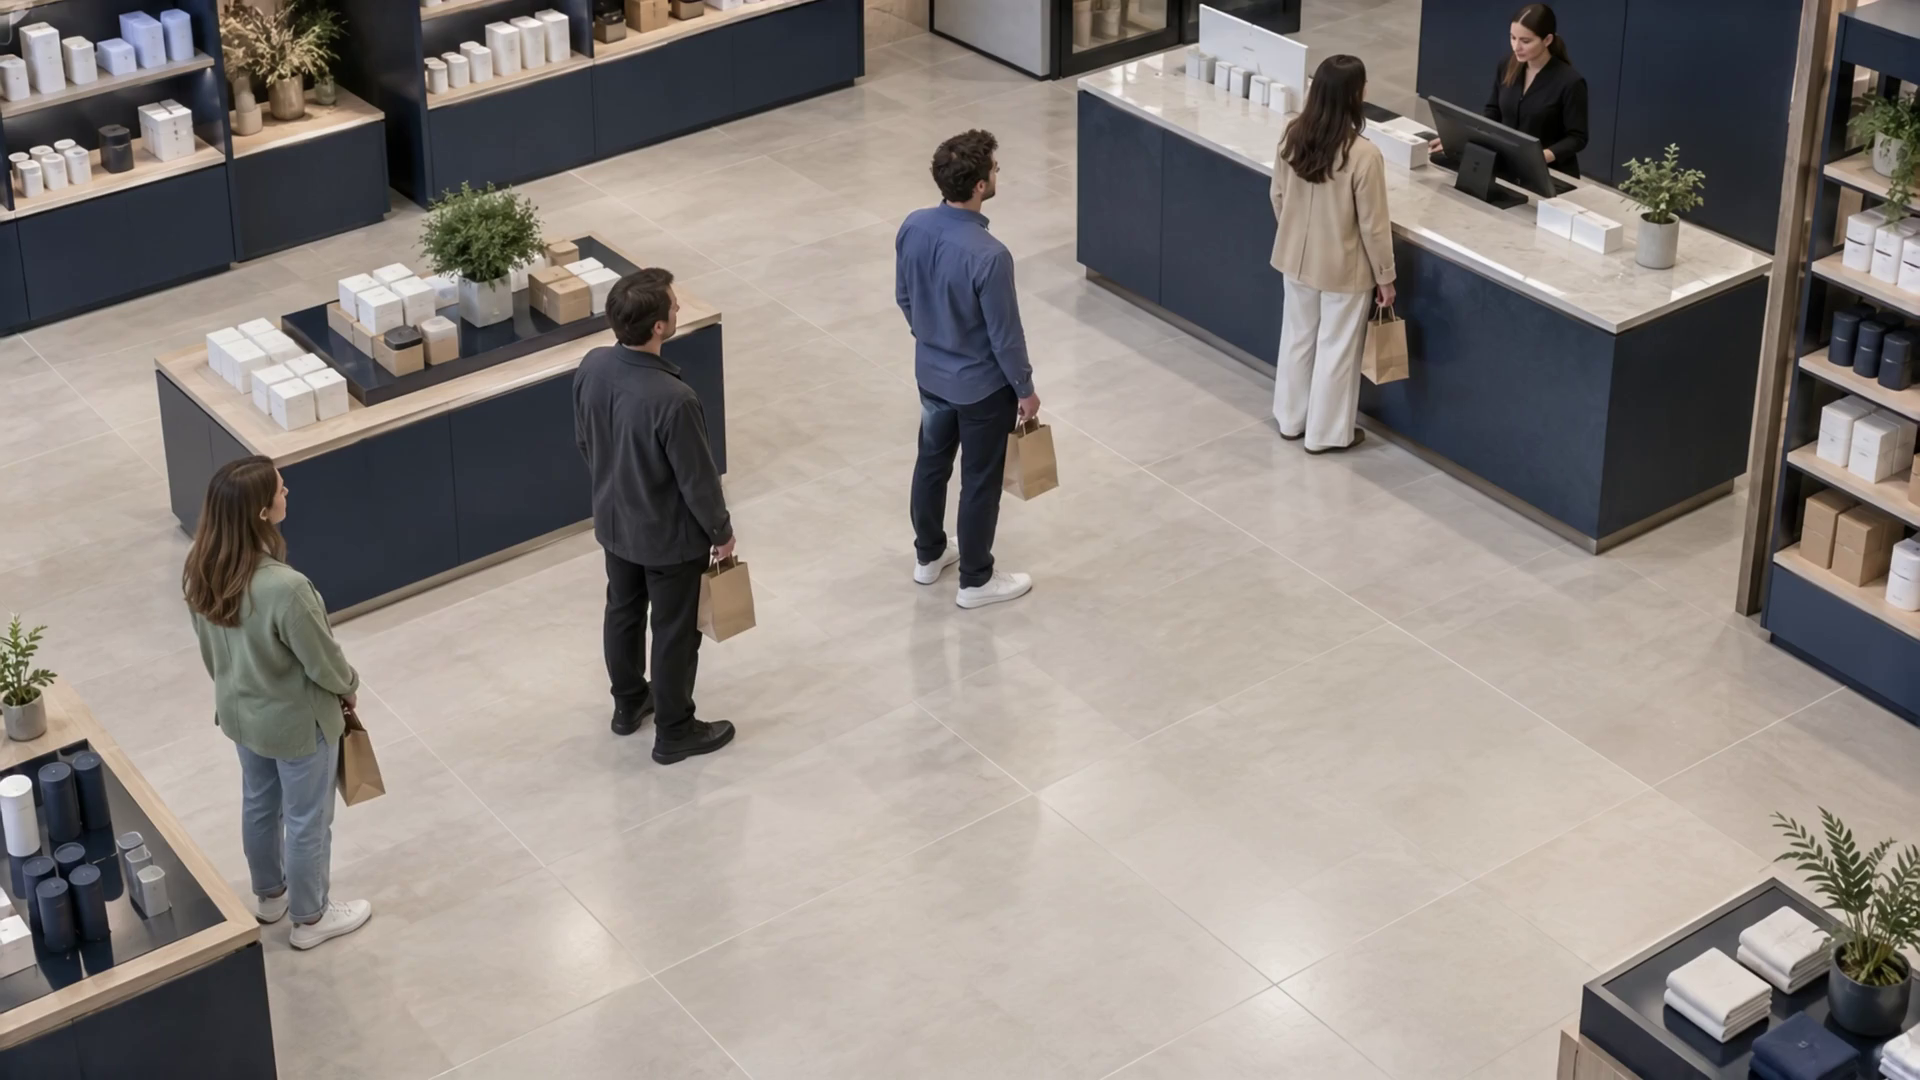
Three waiting behind one at service
Four customers are visible: three behind the service position and one at the counter. The cashier is counted separately.
A busy store creates questions that transactions alone cannot answer. Where are people waiting? Which area is crowded? What happened in the stockroom? Opsyte helps store and centre teams turn selected camera views into structured events and operational context, from the entrance to the loading bay.
Preparing for launch · tailored walkthroughs available VISION → CONTEXT → ACTION
Four customers are visible: three behind the service position and one at the counter. The cashier is counted separately.
Three people behind the customer at the service position; the person being served is excluded.
Positions and counts were manually reviewed every 0.5 seconds from 0 to 6 seconds. Interpolated boxes are approximate visual annotations, not live model inference. Event markers identify a confirming sampled frame, not an exact crossing instant.
Watch a sustained checkout queue in the agreed area.
Queue and occupancy conditions give managers a practical reason to review coverage where the pressure is visible.
Observe footfall, dwell and activity in defined zones, then compare periods without identifying individual shoppers.
Find a relevant entry, object or out-of-hours event with its camera, location and time already attached.
Explore specific operational jobs—not just a list of AI features. Each example explains the condition, useful evidence and the team’s next step.
Help store teams notice when checkout capacity deserves attention.
Checkout queue
The defined queue exceeds its configured threshold.
Queue event, camera, time and a selected snapshot.
The store manager reviews the situation and adjusts checkout coverage.
Illustrative configuration, not a recorded customer outcome. Camera suitability, analysis scope and the response workflow are agreed during setup.
Follow the practical steps for this environment. Each one connects the technology to the people who will use the result.
Choose a checkout queue, entrance flow or staff-area boundary that your operations team wants to understand.
Define the area and condition for each selected view. A queue threshold and an access boundary need different configurations.
Show the store, camera and evidence and agree which events belong with operations, facilities or security.
Use the same defined objective to review periods and locations and identify where the team wants to change coverage or flow.
Turn a view into useful data. Explore model families for people, service, safety, movement and production. Configure the measurements around your operation—and connect them to the questions that matter.
See when people arrive and how demand changes through the day.
A configured counting view supplies passage counts. The example compares two separate entrance views.
Illustrative data · change the location or period to recalculate every metric and report.
Passage counts in each observation window.
Interval total. Adds interval values for the selected sites and period.
Higher bars show busier arrival periods; the total adds the selected windows and separate sites.
A passage count is not a count of unique customers or verified identities. Overlapping views need duplicate handling.Arrival boundary
Arrival boundary
The illustrative records use equal 15-minute periods. These are example records, not customer measurements.
Example09:00–09:15 · illustrativeEvery measure belongs to a selected camera, location and monitoring area.
ExampleSite A · selected camera and zonePeople counted through the configured entrance or counting boundary during the period.
Example18 observed passagesThe defined entrance or line that gives the count its meaning.
ExampleMain entranceWe map the camera, model, collection fields and report to that decision—and validate what works in your environment.
From a connected camera to an event your team can understand. Explore the decisions and controls behind the experience.
The first step is understanding what your cameras can show and how to access the selected feeds securely. Opsyte works with your IT or CCTV team to connect the views that support a real monitoring objective. Camera inventory, network arrangements and feed stability become part of a planned setup.
 /Camera connectivityProduct illustration
Camera credentials belong in the secure onboarding flow—not this example.
List the priority locations and what each selected view needs to reveal: a queue, boundary, bay or work area.
A configured threshold produces an event for the store manager, with the selected queue scene ready to review.
Available footfall observations help the team compare arrival patterns and plan service coverage.
A zone event gives the responsible manager context to check permitted access, rather than guessing intent from an image.
You bring the operational question. Together, we define the camera coverage, the analysis and what your team should do with the result.
The next page opens an editable inquiry with your selected industry and scenario. No camera credentials or footage are needed here.
Discuss this pilotUnderstand the practical details before you plan your first deployment.
Yes. The platform can organize configured queue, footfall, occupancy and dwell observations alongside security-related events. Each objective has its own camera selection, useful evidence and responsible team.
The examples here concern visible counts, movement, zones and events. They do not identify shoppers, infer demographics or establish criminal intent. A flagged scene gives your team something to review in context.
The monitoring objective is configured around the selected camera and zone. Agree thresholds, hours and response ownership for each store rather than applying one unreviewed rule everywhere.
Choose a small set of priority views and a useful first objective. We validate connectivity and tune that scope with your team, then plan expansion around the locations and questions that prove valuable.
Tell us what your team needs to see, understand or improve. We will help shape the right walkthrough and pilot scope.